Book Free Diagnostic
Ecommerce Performance Marketing Agency
Ecommerce Performance Marketing Agency
The demand was already there. The account’s setup was holding it back.
The search data showed real purchase intent, but performance had stopped improving.
10.26×Google Ads account ROAS
Full-year 2023
CA$1.55M attributed revenue on CA$151K of spend.
By campaignPerformance Max 9.38×. Search 19.76×, which includes branded queries.
ContextGoogle Ads only. Bing and Meta were added in 2024, and the September 2024 figures on this page are measured differently.
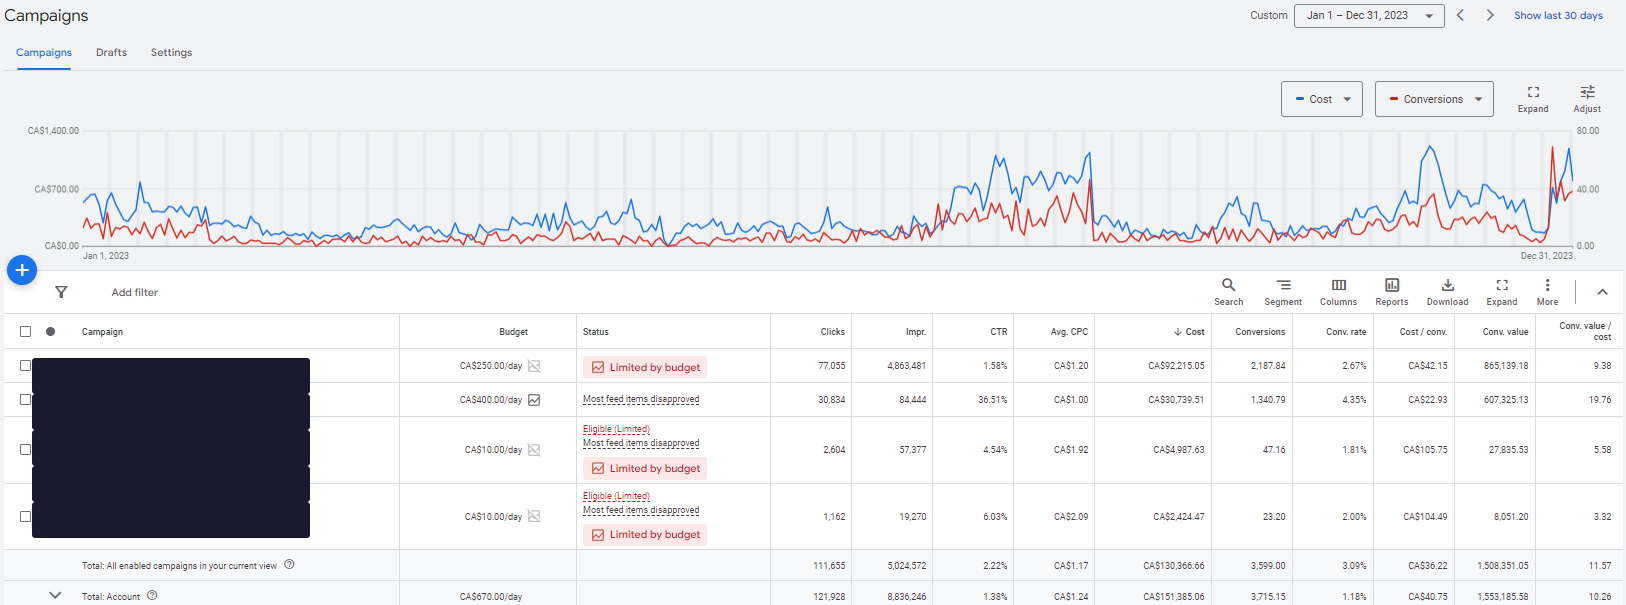
Brand identity withheld per client NDA. Campaign names redacted.
The account had measurable search demand. Terms like “sateen duvet cover” and “linen sheet set” showed purchase intent in the search-term data. The conversion rate on those queries was solid. The issue was structural, not demand.
Performance had stopped improving. Four structural constraints were working against the account: unused purchaser data, feed titles written for inventory rather than search, broad match diluting intent, and campaign roles without clear governance. None was dramatic in isolation. Held for a full year in a high-AOV category, they compound.
First-party customer signals were unused
Thousands of verified purchasers sat in the CRM. None of that data had ever been uploaded to Google as Customer Match. Performance Max was learning from scratch, with no reference point for who the brand’s best customers were.
Product titles reflected internal language, not search demand
The feed was built at Shopify launch and never touched. Titles used internal collection names and fabric codes, not the language buyers use. Product visibility on high-intent queries suffered for it.
Broad match was diluting Search intent
Search was bidding on exploratory and comparison queries at the same level as high-intent buyers. We shifted toward phrase and exact match where the account data supported it, concentrating spend around terms associated with purchase behavior.
Performance Max and Search lacked clearly governed roles
No clear framework existed for what Search should own versus where PMax should handle broader coverage. Budget allocation, query analysis, and campaign-level reporting were all harder to interpret as a result.
If your account is producing revenue but hasn’t improved in several quarters, the constraint is probably structural: customer signals Google isn’t using, product data that doesn’t match buyer language, or campaign roles that have blurred over time.
That’s what the Growth Diagnostic is designed to surface →If you recognized your account in those findings, a diagnostic session surfaces the same structural gaps and gives you a prioritized plan to address them.
We exported the client’s verified purchaser list and applied it to Performance Max as a Customer Match signal. PMax had a first-party reference point for the brand’s best customers instead of learning from platform-observed behavior alone.
Every title was rewritten to lead with what shoppers search for: “Luxury Cotton Duvet Cover Set [size] [material]” instead of internal collection names or fabric codes. Visibility on high-intent terms improved.
We moved Search away from broad match, tightening to phrase and exact where the account data supported it. Budget concentrated around queries tied to purchase behavior.
We built negative keyword lists to enforce query ownership between PMax and Search, and excluded wholesale, trade, and gift registry queries at the account level. Spend became easier to govern, and easier to evaluate.
No single dramatic intervention. Four structural adjustments: clearer customer signals, feed language aligned with buyer search behavior, tighter Search targeting, and governed campaign roles. Sustained over twelve months. That’s what shows up in a full-year result.
These figures reflect the complete 2023 account view: every month, not a selected window.
| Metric | Linen & Home Performance | Notes |
|---|---|---|
| Google Ads Account ROAS | 10.26× | Full account view, all campaigns |
| Performance Max ROAS | 9.38× | Product + audience coverage; Customer Match seeded |
| Search ROAS | 19.76× | Brand + high-intent category; includes branded queries |
| Attributed Revenue | CA$1.55M | Platform-attributed; Google Ads reported |
| Managed Spend | CA$151K | Total account spend, full year |
| Documented Period | Jan 1 – Dec 31, 2023 | Complete calendar year; no window selection |
Performance Max ran with verified purchaser data and a rebuilt feed. Search concentrated on brand and higher-intent category terms with tighter match-type controls. Each campaign had a defined job.
The full-year view means the strong months did not carry the weak ones. This was the account’s result across all of them.
The Search ROAS of 19.76× includes branded queries. In a high-AOV category where buyers return to search by brand name before purchasing, branded Search carries real conversion weight. It is not a separate line item we exclude from the account result.
All performance data sourced directly from the client’s Google Ads account. Platform-attributed revenue.
After the 2023 Google build, MESAscale expanded management to Bing/Microsoft Ads and Meta. The approach was the same: defined channel roles, governed budgets, and spend concentrated where buyer behavior supported it. The September 2024 data below is a single-month expansion sample, with Bing and Meta newly introduced channels at this point, not multi-year track records. Google held close to its 2023 level, though the two periods are measured differently (see the note under the table).
| Platform | Managed Spend | Attributed Revenue | ROAS | Transactions |
|---|---|---|---|---|
|
Google Ads
5 campaigns · sustained from 2023 build
|
CA$11,968 | CA$113,912 | 9.52× | 262 |
|
Bing / Microsoft Ads
2 campaigns · newly introduced
|
CA$2,447 | CA$10,692 | 4.37× | — |
|
Meta Ads
Facebook + Instagram · newly introduced
|
CA$2,313 | CA$12,019 | 5.20× | — |
| Combined · September 2024 | CA$16,728 | CA$136,623 | 8.17× | 262+ |
Brand identity withheld per client NDA. Google: last non-direct click via GA4. Meta: 7-day click / 1-day view (platform-reported). Bing: platform-reported. Bing and Meta figures represent the first month of each channel’s managed spend. The combined row adds revenue as each platform reports it and is not deduplicated across channels.
Share a few details about your brand and advertising. We’ll identify opportunities to improve performance and drive more profitable growth.
Kelvin reads every enquiry and will reply by email. If it’s urgent, call 416.783.1157.